In the last post, I had loaded up the bike with a simple timing curve and taken it for a test ride. However, I have been meaning to actually measure the timing advance with the stock ignition unit rather than relying on hearsay. This weekend I finally press-ganged Kathy into helping.
When I previously had attempted to measure the timing at anything higher than idle, I had gotten my face sprayed with oil being blown out of the hole you open up to see the timing marks. The air in the crankcase gets pushed out when the pistons go down, and while this normally gets vented into the airbox, the air likes to take the path of least resistance and prefers to go out this hole when given the chance. First order of business was thus to manufacture a “window” of plexiglas that could be put over the hole to avoid this problem.
The window worked surprisingly well, I duct taped it to the crankcase and it held up almost half the session… Once the engine got hot and the oil started trickling out the hole, the duct tape quickly turned into something resembling used chewing gum and I had to resort to holding the window in place with my fingers. Which was fine except that once the engine’s hot it was hard to do for a long time, even with welding gloves.
Anyway, Kathy had the responsibility of revving the engine to the requested RPM and writing down the data. I handled the timing light and holding the window in place. It didn’t take long until we had some decent data:
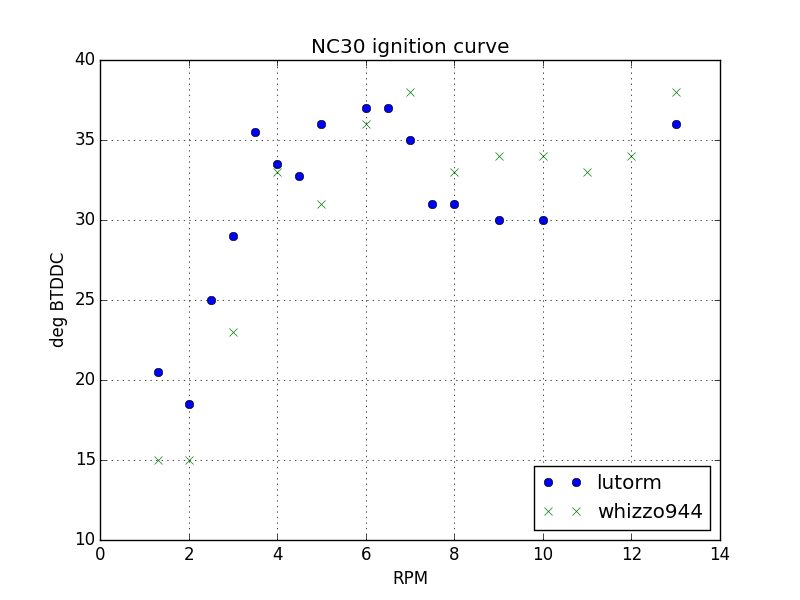
The ignition advance as a function of RPM as measured with the stock ignition unit. My points are in blue and the corresponding measurement by user “whizzo944” at 400greybike.com is in green. Interestingly the wiggle at 4k RPM appears to be real, as it shows up in both sets of data.
The plot also has overlaid points from a plot I got from “whizzo944” at the 400greybike forums. There are some systematic differences, but the behavior is quite similar. In particular, we both have a peak and subsequent drop at 4k, and then a drop between 7-12k (although we only measured 13k because it’s so painful to rev the bike that high). The slight retard between 8-12k isn’t so surprising, since that’s where the torque peak is; engines often need a bit of retarded timing in that region, because that’s where the cylinder filling is the highest. I’m not sure what’s going on with the dip at 4k though.
The striking difference between these curves and the “linear between 2-12k” that I used in the first test drive is how fast this curve advances. This should make quite a bit of difference in the amount of low-end power. Naturally, I had to take it for another test ride.
It did indeed feel like it had a lot better low-end torque, and it also ran less hot than last time, which would make sense since retarded timing puts a lot more heat out in the exhaust port that is never converted to mechanical power. However, when I did a full-throttle test in high gear from very low RPM, it was pretty clear that there is a severe flat spot in the 5-6k RPM region, and just under 6k I also heard something that sounded very much like knocking. Had I put in too much advance at low RPM?
Zooming in on that full-throttle run in the data log, it looks like this (click on the plot to see it in full res):
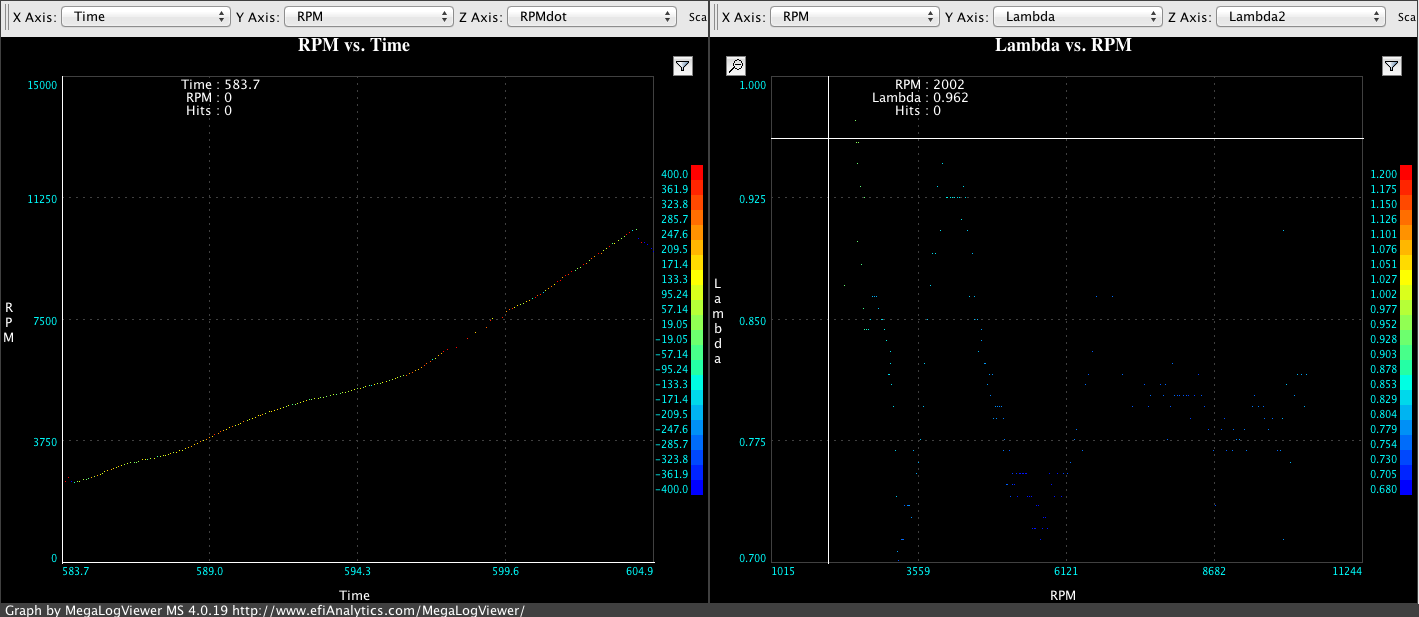
The full-throttle run. You may have to zoom in to see the points clearly. The left plot shows RPM as a function of time, clearly showing the “flat spot” between 5-6k RPM. The plot on the right is lambda as a function of RPM. The regions of slow acceleration on the left clearly coincide with the bike running so rich it saturates the wideband sensor at lambda 0.68.
The data log makes it clear that the regions where the bike accelerates really poorly, at 3k and 5-6k RPM, are exactly where the oxygen sensor shows it running so rich it actually saturates the wideband sensor, meaning lamda < 0.68! (That’s an air/fuel ratio less than 10:1 for those of you who don’t like to think in lambda.) The thing I heard that sounded like knocking was more likely the engine misfiring from being so rich. Once above 6k, it starts pulling comparatively well, and there the lambda is “only” 0.77-0.80. As I said before, once it’s possible to dial in a reasonable air/fuel ratio, it should run way better.
Speaking of that, I think this means the ignition part of the project (the “easy” part…) is pretty much complete. Now it’s time to take the carburetors out and figure out how to mount the throttle bodies and the fuel injectors.