Over the past week, I’ve done a bunch of tuning rides on the NC30, logging data and tweaking the tables. Compared to the first run, it’s now fully rideable with only a few touchy points.
The main task when tuning the fuel injection is to calibrate the “VE table”. VE stands for “volumetric efficiency” and is the basic number describing how much air the engine is pumping. The entire function of the fuel injection system is to supply the engine with the proper amount of fuel for the air it’s getting, so calculating the mass of air is half the work. The other is calculating the corresponding mass of fuel and making sure it gets into the engine. That’s arguably the simpler part, once the injectors have been characterized.
The basic calculation is that, for every stroke of the engine, a cylinder sucks in an volume of air equal to its displacement. If the density of the air is known (which you can calculate from its pressure and temperature, both measured, using the ideal gas law) you know the mass of air pumped. Depending on the operating point, the air/fuel ratio changes from around 14.7 at low throttle to 12.5 at full throttle, but how to set this is pretty well known.
The complication is that the engine is not an ideal air pump. Especially at low throttle, it has to suck air past the closed throttle plate, and it also has to suck it past the intake valve. The intake system and airbox has some resonance behaviors that affect airflow. Because of valve overlap, some combustion products get pushed out into the intake when the intake valve opens, and so on. All these effects add up to the engine not pumping as much air as it ideally would, and this is the volumetric efficiency. The VE mainly varies with RPM and manifold pressure, so the Megasquirt has a 2D table of VE against these two inputs that it uses to look up the VE and calculate the length of every fuel injection event.
Since you can’t calculate the VE, it has to be measured by running the engine through all these operating points and adjusting the amount of fuel injected until the measured air/fuel ratio from the oxygen sensor in the exhaust agrees with the desired value.
In the end, you get something like this:
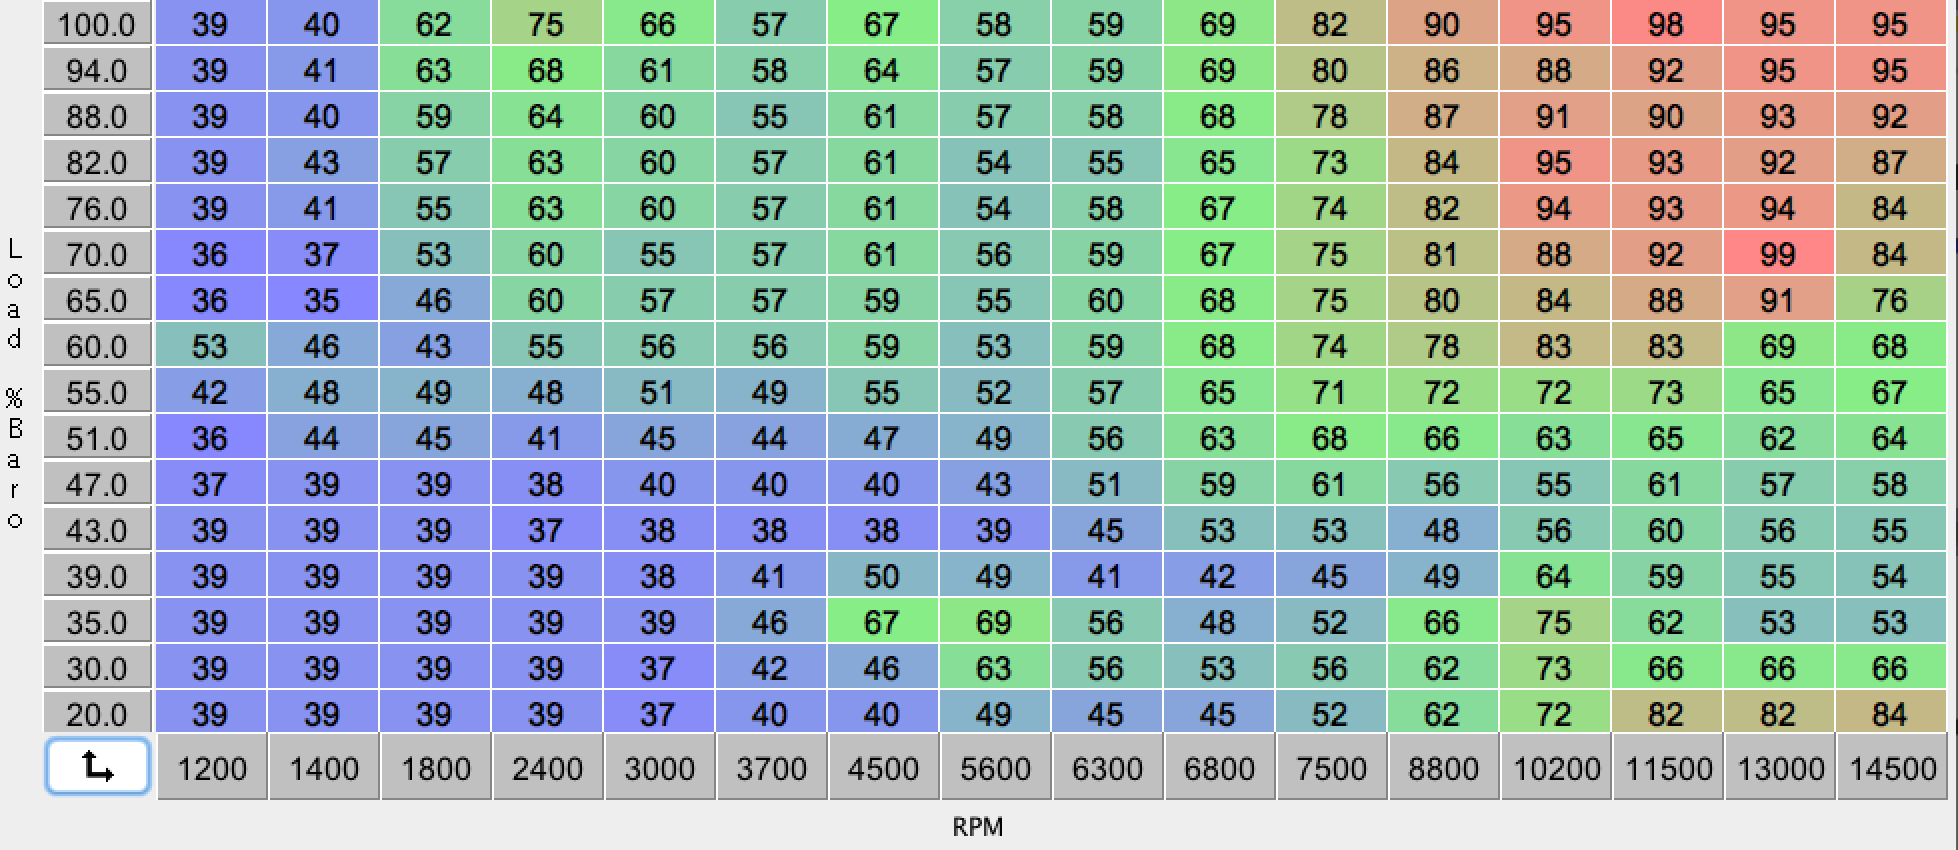
My current VE table (for cylinders 1/3.) The X-axis is RPM and the Y-axis manifold pressure (as a percentage of ambient pressure.) In general the VE table should be smooth, and there are still some bumpy spots here showing I have more to do.
This is my current VE table. How well does it work? Here’s a plot of the difference between the desired and measured lambda (ratio of air fuel ratios) on my last ride:
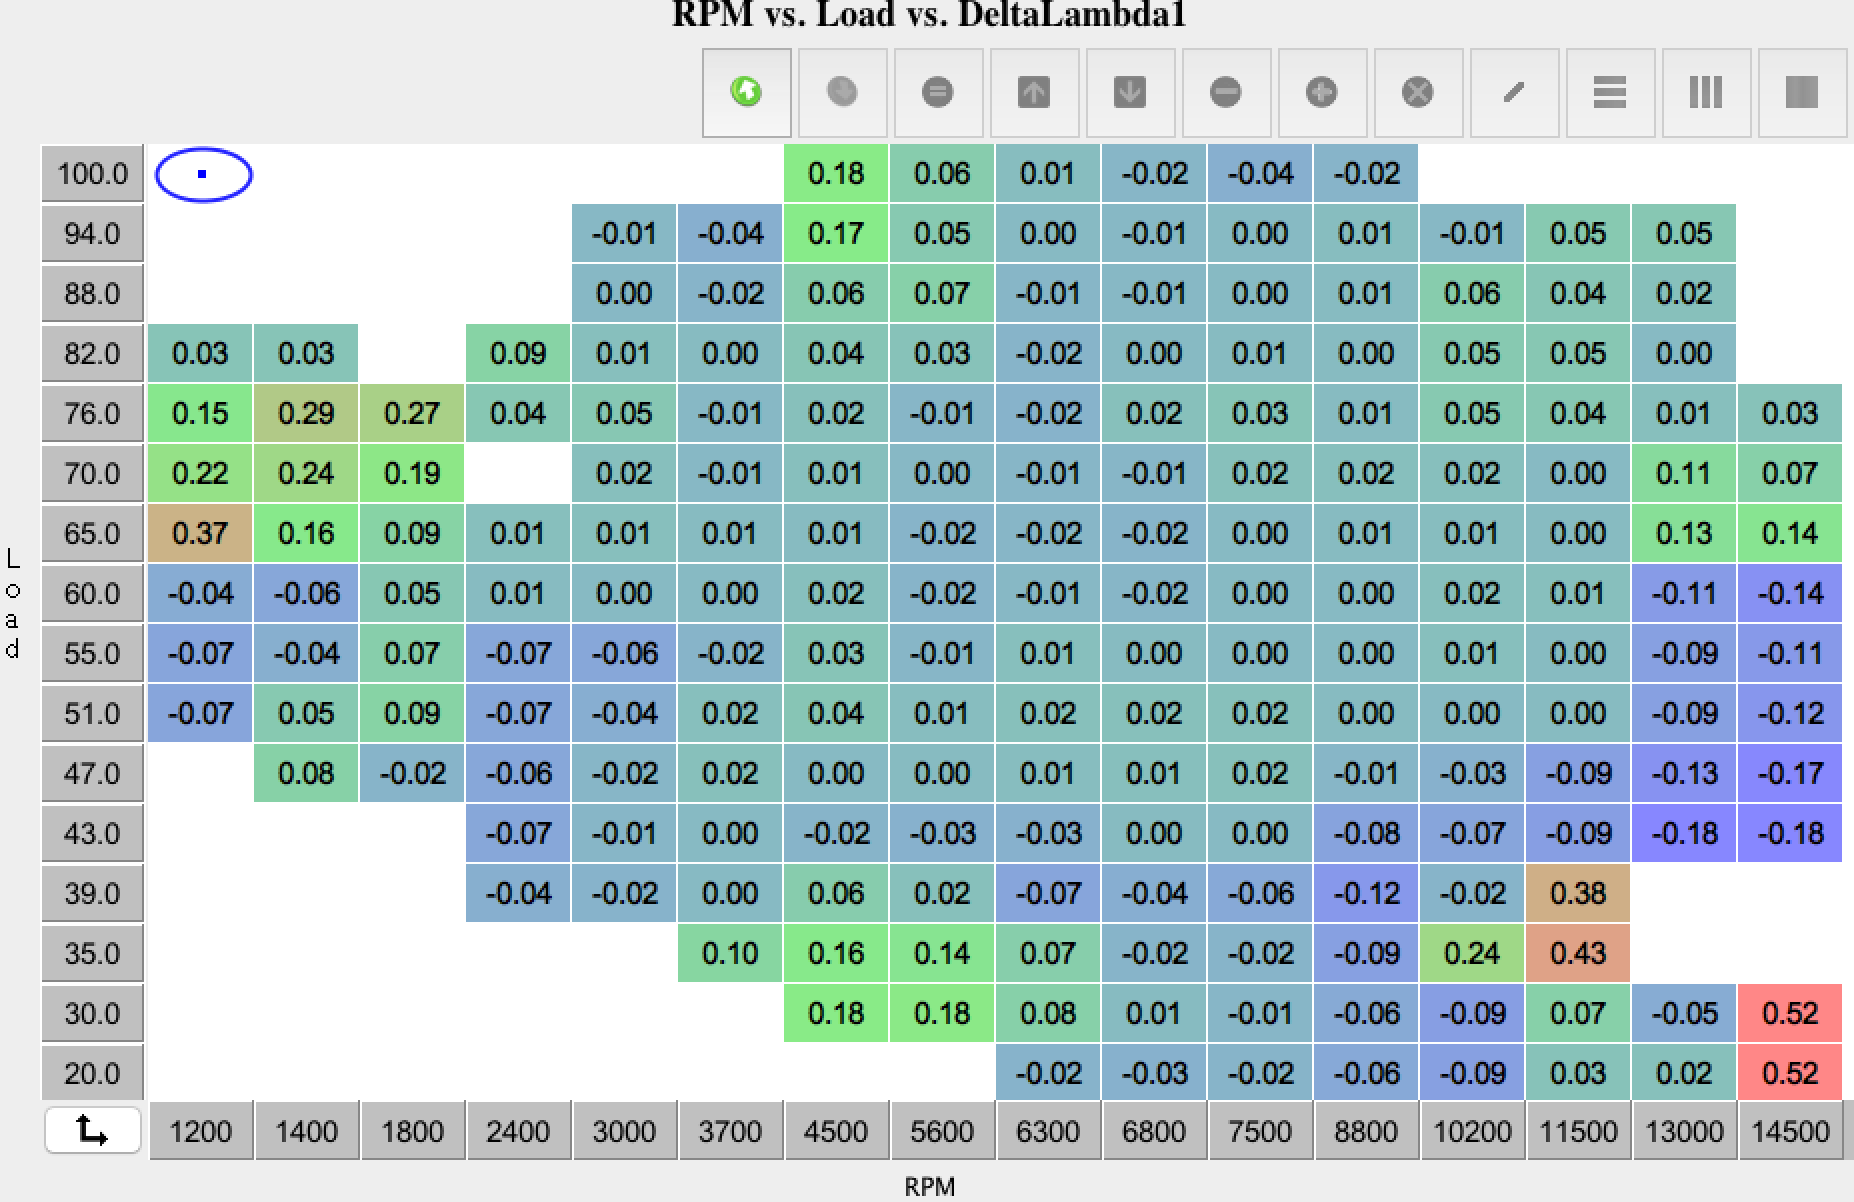
The difference between measured and desired lambda (air/fuel ratio relative to stoichiometric). Positive values mean the engine is running leaner than intended, negative values richer. X and Y axes are the same as on the VE plot.
Over most of the table, the values are within 0.05 and many are within 0.02, which is quite good. There are a few lean spots, at 4500 RPM and full throttle (Y-axis 100% of barometric pressure) and at 11500 RPM and >60% barometric pressure. The very large values in the lower right corner are not real, that’s when rolling off the throttle from a full-throttle run to the rev limiter, which makes the wideband sensor read bogus.
Here’s an excerpt from the log for that full-throttle run (you may have to click on the plot to enlarge it to see clearly).
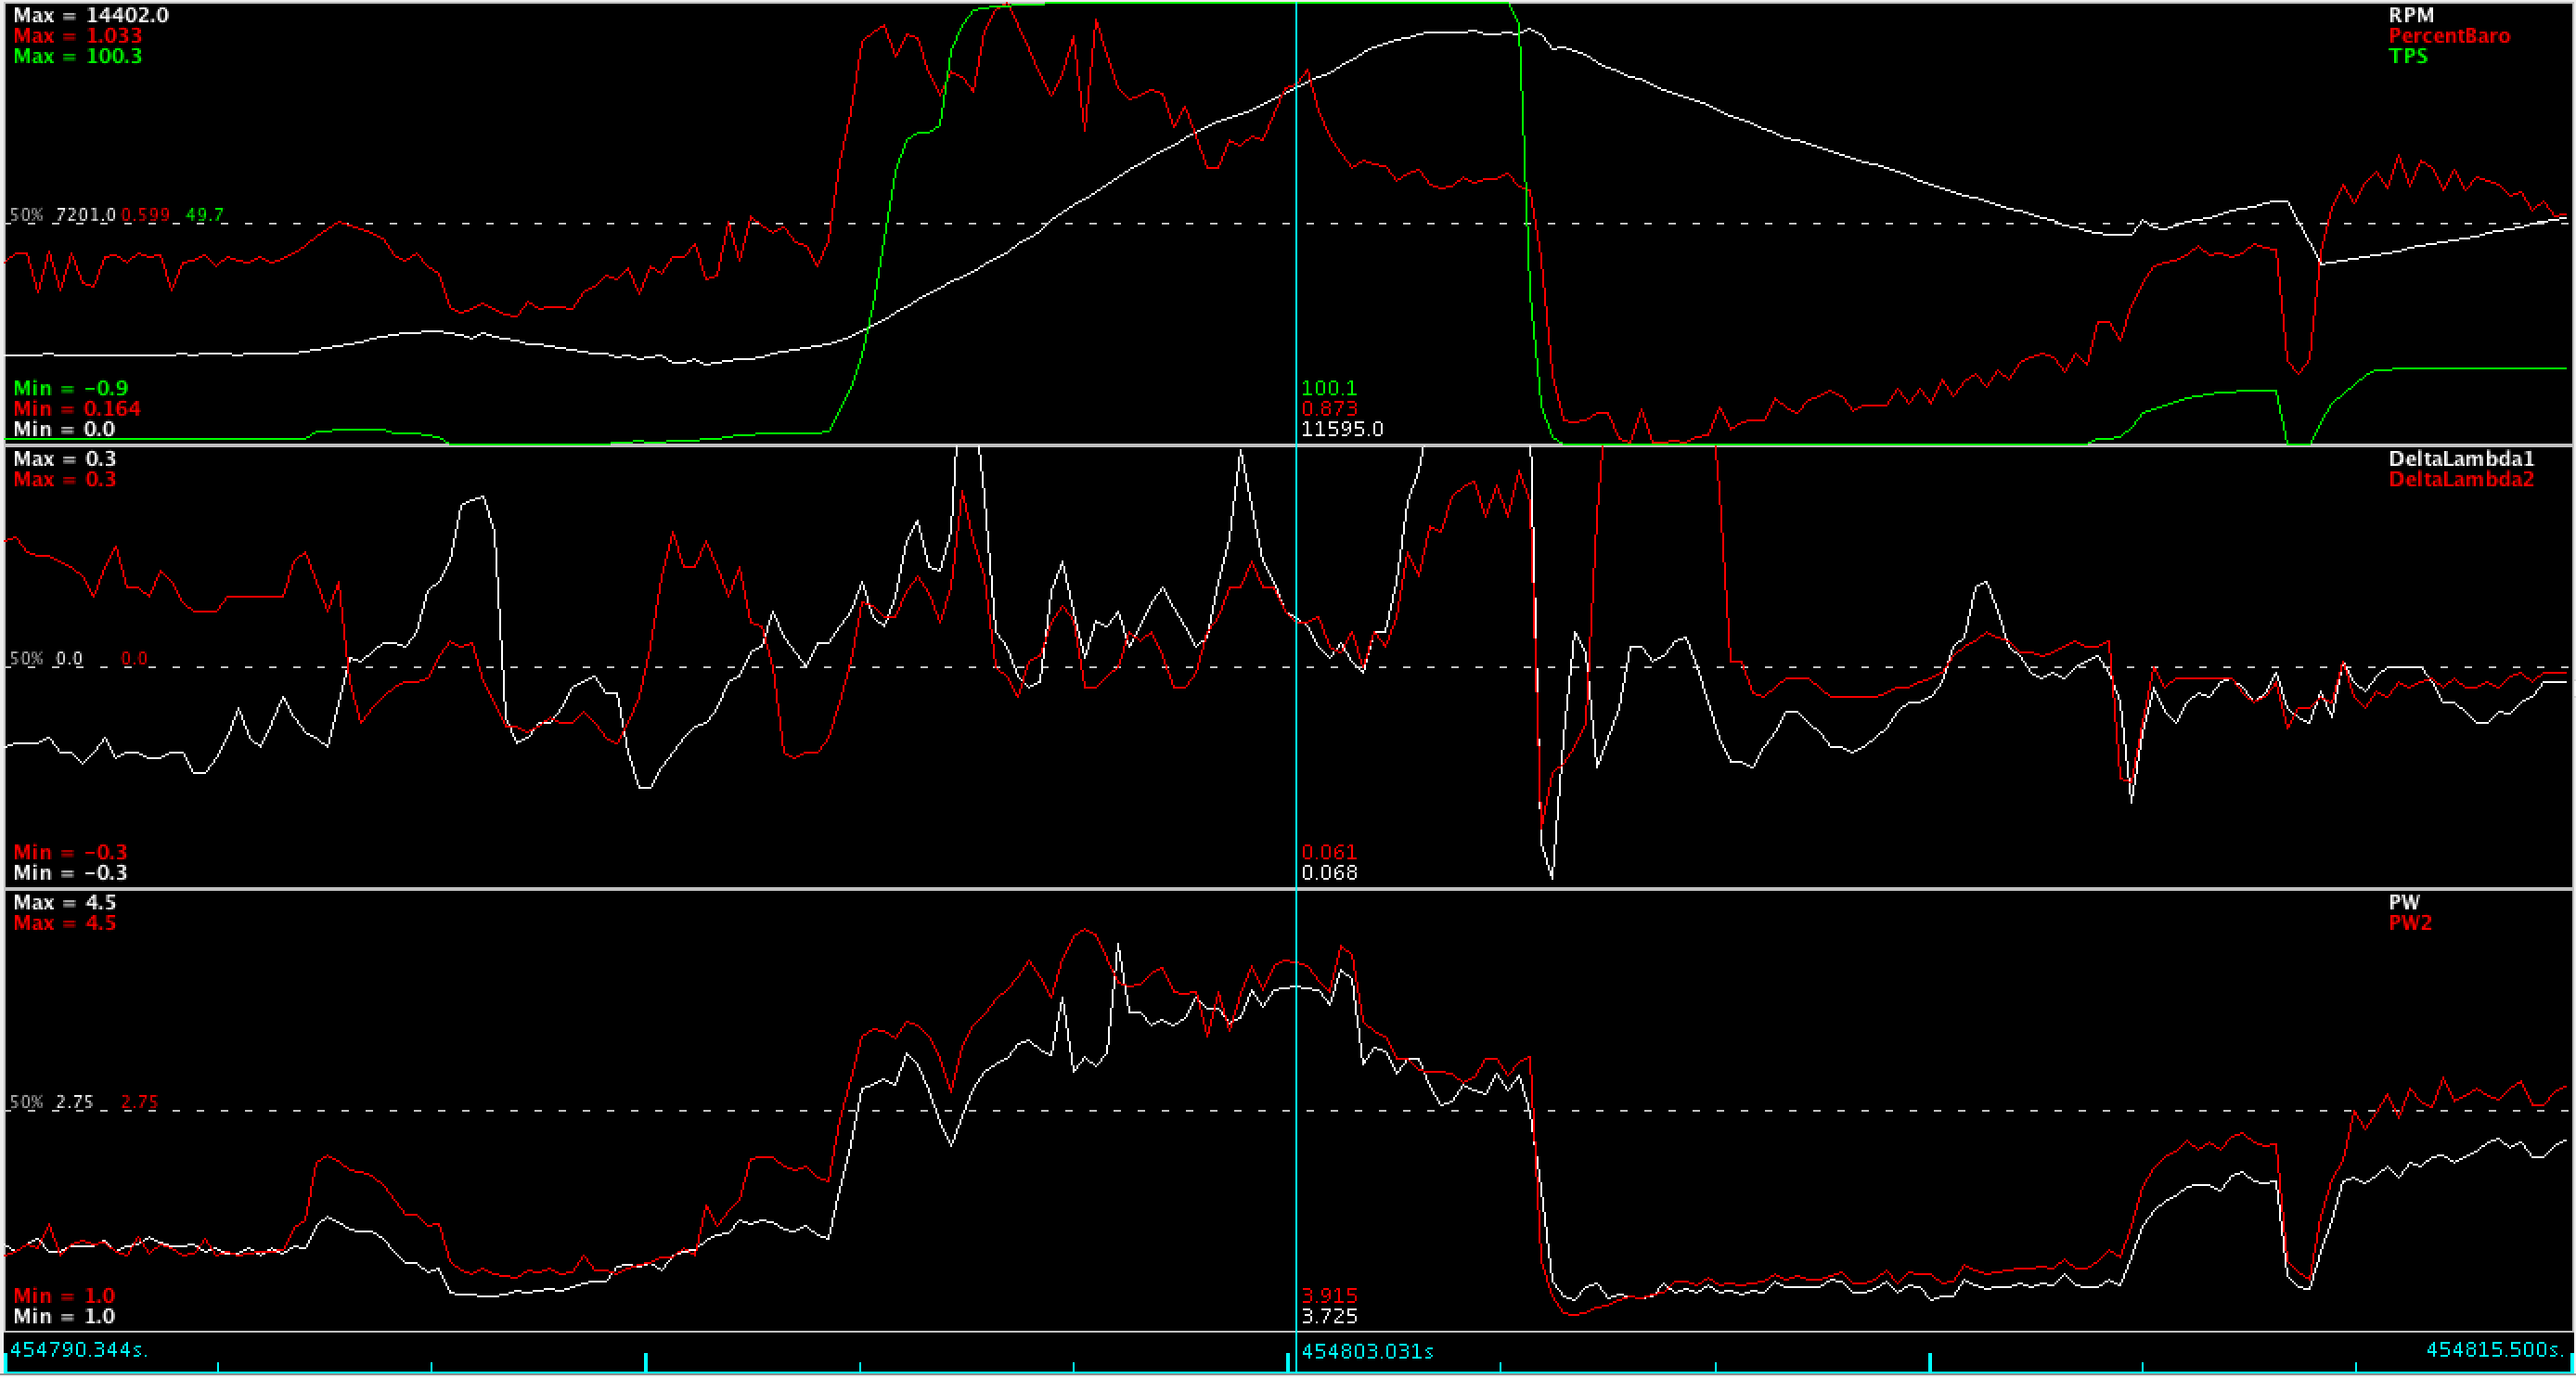
An excerpt from the log file showing a full throttle run to redline. The top pane shows RPM in white, manifold pressure in red, and throttle position in green. The second pane shows the air/fuel ratios of cylinders 1/3 (white) and 2/4 (red) compared to the target values. The third pane shows injector pulse widths. Note the lean spot at 10750 RPM (just to the left of the vertical marker) where Lambda1 shoots up. The RPM trace also shows acceleration dropping off here and the engine runs too lean to develop peak power. Also note that once the engine hits the rev limiter, the lambda shoots up. This is because it shuts off the spark, sending unburned air out into the exhaust.
The log analyzer program, “Mega Log Viewer”, can calculate an updated VE table based on the information in plots like these, so then you update the VE table in the Microsquirt and go for another test ride, and repeat as necessary.
So that’ s the tuning basics. I’ve encountered a few subtleties beyond this, but I’ll leave them for another time.
Pingback: Microsquirting the NC30, part #43: A small setback – Patrik's projects
Pingback: Microsquirting the NC30, part #45: More tuning – Patrik's projects